
ESP32/Arduino Sensor Data Visualization on Web Apps: A Beginner's Guide with Directus: Part 2
With over a decade of hands-on experience, I specialize in building robust web applications and scalable software solutions. My expertise spans across cutting-edge frameworks and technologies, including Node.js, React, Angular, Vue.js, and Laravel. I also delve into hardware integration with ESP32 and Arduino, creating IoT solutions.
Welcome back! In Part 1, you built the ESP32 circuit and verified that your sensor works properly. Now, it's time to connect your ESP32 to the web world and visualize those sensor readings!
In this part, we'll focus on sending data from your ESP32 to a user-friendly web dashboard. Here, we'll leverage the power of Directus. But before we dive in, let's address a key question you might have:
Why Directus and Sockets?
There are several reasons why Directus is a great choice for this project, and one of them is its built-in socket connection functionality. Sockets might be a new term for some beginners, so let's break it down:
- Imagine a socket as a dedicated communication channel between your ESP32 and the web dashboard (Directus). It's like a direct line where data can be exchanged quickly and efficiently.
Now, you might wonder, "Why use sockets instead of the REST APIs that Directus also offers?" Here's the key difference:
- Real-time Data vs. Periodic Updates: REST APIs are fantastic for various data exchange scenarios, but for our project where we want to see sensor readings almost instantly (in milliseconds), sockets are a better fit. They provide a more real-time connection, allowing the ESP32 to send data as soon as it's collected, minimizing delays.
Here's an analogy: Think of REST APIs like checking your mailbox for letters – you might get them a few times a day. Sockets, on the other hand, are like having a live chat with someone – information is exchanged almost instantly.
In short, sockets are ideal for our project because we want to see sensor readings with minimal delay.
1.Sending Sensor Data to Directus with ESP32 and WebSockets
Now that we understand why sockets are a good choice for real-time data transmission, let's delve into the code that sends sensor data from your ESP32 to the web dashboard (Directus).
Libraries and Dependencies:
The code snippet includes several libraries:
WiFi.h: Enables ESP32 to connect to your WiFi network.WebSocketsClient.h: Provides functionalities for establishing WebSocket connections.To use it, you should download the zip and Click the 'Download ZIP' button"
then go to Arduino ide → menu → sketch→ manage libraries → upload library
ArduinoJson.h: Allows working with JSON data format for sending and receiving data.
(If not installed you can install it directly from the library manager)
DHT.h: Specific to the DHT11 sensor, used for interacting with the sensor and reading temperature/humidity values.
User-Defined Variables:
WiFi Settings: Replace
XXXXXwith your actual WiFi network name (SSID) and password.Socket.IOSettings: These define the connection details for your Directus server. You'll need to replace placeholders like
hostIP address you’re connecting with to Directus (your IP machine)port:8055Directus Access Token: Replace
Dirctus_user_tokenwith a valid access token you generated in your Directus dashboard when you created a userCollection: Set
dht_sensorto the collection nameTime Variables: These variables help manage the timing of sensor readings and data transmission.
#include <WiFi.h>
#include <WebSocketsClient.h>
#include <ArduinoJson.h>
#include "DHT.h"

/////////////////////////////////////
////// USER DEFINED VARIABLES //////
///////////////////////////////////
/// WIFI Settings ///
const char* ssid = "ssid";
const char* password = "password";

/// Socket.IO Settings ///
char host[] = "IP";    // Socket.IO Server Address
int port = 8055;                  // Socket.IO Port Address
char path[] = "/websocket";       // Socket.IO Base Path

const char* access_token = "DirctusToken";
const char* collection = "dht_sensor";

/// Pin Settings ///
#define DHTPIN 2
#define DHTTYPE DHT11

DHT dht(DHTPIN, DHTTYPE);

// time excuting
unsigned long startTime;
const int delayTime = 5000;
unsigned long currentTime;
bool isReadyToSend = false;

/////////////////////////////////////
////// ESP32 Socket.IO Client //////
///////////////////////////////////

WebSocketsClient webSocket;
WiFiClient client;


void authenticate() {
  JsonDocument doc;
  doc["type"] = "auth";
  doc["access_token"] = access_token;

  String message;
  serializeJson(doc, message);
  webSocket.sendTXT(message);
}

void traitPayload(uint8_t* payload) {
  JsonDocument doc;
  DeserializationError error = deserializeJson(doc, payload);

  if (error) {
    Serial.print(F("deserializeJson() failed: "));
    Serial.println(error.f_str());
    return;
  }

  const char* typeValue = doc["type"];
  const char* statusValue = doc["status"];
  const char* event = doc["event"];

  if (strcmp(typeValue, "auth") == 0 && strcmp(statusValue, "ok") == 0) {
    Serial.println("[EVENT] SUBSCRIBE");
    subscribe();
  }
  if (strcmp(typeValue, "subscription") == 0 && strcmp(event, "init") == 0) {
    Serial.println("[EVENT] INIT TO SEND");
    isReadyToSend = true;
  }
  if (strcmp(typeValue, "ping") == 0) {
    Serial.println("[EVENT] SEND PONG");
    pong();
  }
}

void subscribe() {
  JsonDocument doc;
  doc["type"] = "subscribe";
  doc["collection"] = collection;
  doc["query"]["fields"] = doc["query"]["fields"].to<JsonArray>();
  doc["query"]["fields"].add("*");

  String message;
  serializeJson(doc, message);

  Serial.println("[EVENT] SEND SUBSCRIBE");
  Serial.println(message);

  webSocket.sendTXT(message);
}
void pong() {
  JsonDocument doc;
  doc["type"] = "pong";
  String message;
  serializeJson(doc, message);
  webSocket.sendTXT(message);
}
void sendData() {
  float humidity = dht.readHumidity();
  float temperatureC = dht.readTemperature();

  if (isnan(humidity) || isnan(temperatureC)) {
    Serial.println("Failed to read from DHT sensor!");
    return;
  }

  Serial.print("Humidity: ");
  Serial.println(humidity);
  Serial.print("Temperature C: ");
  Serial.println(temperatureC);

  JsonDocument doc;
  doc["type"] = "items";
  doc["collection"] = collection;
  doc["action"] = "create";
  doc["data"]["humidity"] = humidity;
  doc["data"]["temperatureC"] = temperatureC;

  String message;
  serializeJson(doc, message);

  Serial.println("[EVENT] SEND DATA");

  webSocket.sendTXT(message);
}
void webSocketEvent(WStype_t type, uint8_t* payload, size_t length) {

  switch (type) {
    case WStype_DISCONNECTED:
      Serial.printf("[WSc] Disconnected!\n");
      break;
    case WStype_CONNECTED:
      Serial.printf("[WSc] Connected to url: %s\n", payload);

      // send Auth to server when Connected
      authenticate();
      break;
    case WStype_TEXT:
      Serial.printf("[WSc] get text: %s\n", payload);
      traitPayload(payload);
      break;
  }
}
void setup() {
  startTime = millis();

  Serial.begin(115200);
  delay(10);


  // We start by connecting to a WiFi network

  Serial.println();
  Serial.println();
  Serial.print("Connecting to ");
  Serial.println(ssid);

  WiFi.begin(ssid, password);

  while (WiFi.status() != WL_CONNECTED) {
    delay(500);
    Serial.print(".");
  }

  Serial.println("");
  Serial.println("WiFi connected");
  Serial.println("IP address: ");
  Serial.println(WiFi.localIP());

  webSocket.onEvent(webSocketEvent);
  // Setup Connection
  webSocket.begin(host, port, path);
}

void loop() {
  webSocket.loop();
  currentTime = millis();

  if (isReadyToSend == true && currentTime - startTime >= delayTime) {
    sendData();
    startTime = currentTime;  // Reset start time for next execution
  }
}
we use JSON (JavaScript Object Notation) to communicate with Directus web dashboard.
- Data Structuring: JSON is a lightweight and human-readable format for exchanging data between devices. It uses key-value pairs to represent data like temperature and humidity readings.
For Example here
JsonDocument doc;
 doc["type"] = "items";
 doc["collection"] = collection;
 doc["action"] = "create";
 doc["data"]["humidity"] = humidity;
 doc["data"]["temperatureC"] = temperatureC;
 String message;
 serializeJson(doc, message);
webSocket.sendTXT(message);
Reference to how to communicate with Directus via Socket:Getting Started With WebSockets
This code creates a JSON document (
doc) with key-value pairs:"type": Set to"items"indicating data for items (sensor readings)"collection": Set to the collection name (e.g.,"dht_sensor") in Directus"action": Set to"create"as we're creating new sensor data entries"data": An object containing actual sensor readings under"humidity"and"temperatureC"keys.
Finally, the JSON document is converted to a string (
message) and sent to Directus using the WebSocket connection.
WebSocket Client and Connection:
webSocketandclientobjects are declared for WebSocket communication.
Authentication Function (authenticate):
- This function sends an authentication message to the Directus server using the provided access token.
Payload Processing Function (traitPayload):
This function receives data (payload) from the Directus server and parses it as JSON.
It checks for different message types like "auth," "subscription," and "ping" and performs actions accordingly.
For "auth" success, it triggers a subscription request.
For successful subscription initialization, it sets a flag (
isReadyToSend) to allow data transmission.For "ping" messages, it sends a "pong" response to maintain the connection.
Subscription Function (subscribe):
- This function sends a subscription message to Directus, requesting data for the specified collection (
collection).
Pong Function (pong):
- This function sends a "pong" message in response to "ping" messages from the server, keeping the connection alive.
Data Sending Function (sendData):
This function reads temperature and humidity values from the DHT11 sensor.
It checks for successful readings and avoids sending invalid data.
It creates a JSON document with sensor data (humidity and temperature) and sends it to Directus using the
webSocket.sendTXTfunction.
WebSocket Event Handler (webSocketEvent):
This function handles different events related to the WebSocket connection.
For "disconnected" events, it logs a message.
For "connected" events, it logs the connection details and initiates authentication.
For "text" events (incoming JSON messages), it calls the
traitPayloadfunction to process the data.
Setup Function (setup):
Initializes serial communication for debugging messages.
Connects to the specified WiFi network using the provided credentials.
The code establishes a WebSocket connection to the Directus server using
webSocket.begin(host, port, path).The
webSocketEventfunction handles different events related to the connection:
Loop Function (loop):
This function continuously runs and checks the WebSocket connection.
It also checks the
isReadyToSendflag and the elapsed time since the last transmission.If the flag is set and enough time has passed (
delayTime), it calls thesendDatafunction to send the latest sensor readings to Directus.
Overall Flow:
The ESP32 connects to WiFi and establishes a WebSocket connection to the Directus server.
Authentication with Directus is performed using the access token.
The ESP32 subscribes to the sensor data collection in Directus.
The ESP32 periodically reads temperature and humidity from the DHT11 sensor.
Sensor readings are packaged as JSON data, and the ESP32 sends this data to Directus through the WebSocket connection.
Directus receives and stores the sensor data in the specified collection.
Important Note: If you encounter the hexdump() error, navigate to the file \libraries\SocketIoClient\SocketIoClient.cpp mentioned in the error message and locate the hexdump() function. Then, comment it out.
1.2 Uploading and Running the Code
Before Uploading:
Secure Directus Server: Ensure your Directus server is up and running before connecting from the ESP32. A non-running server will prevent successful communication.
Verify Connectivity: Double-check that your ESP32 is properly connected to the same network as your Directus server. Network connectivity is crucial for data transmission.
Access Token: Confirm that you've included a valid access token for authentication in your ESP32 code. Without a valid token, Directus will not allow access to send data.
Uploading and Observing Data Transmission:
Upload the Code: Use the Arduino IDE to upload the code to your ESP32 board.
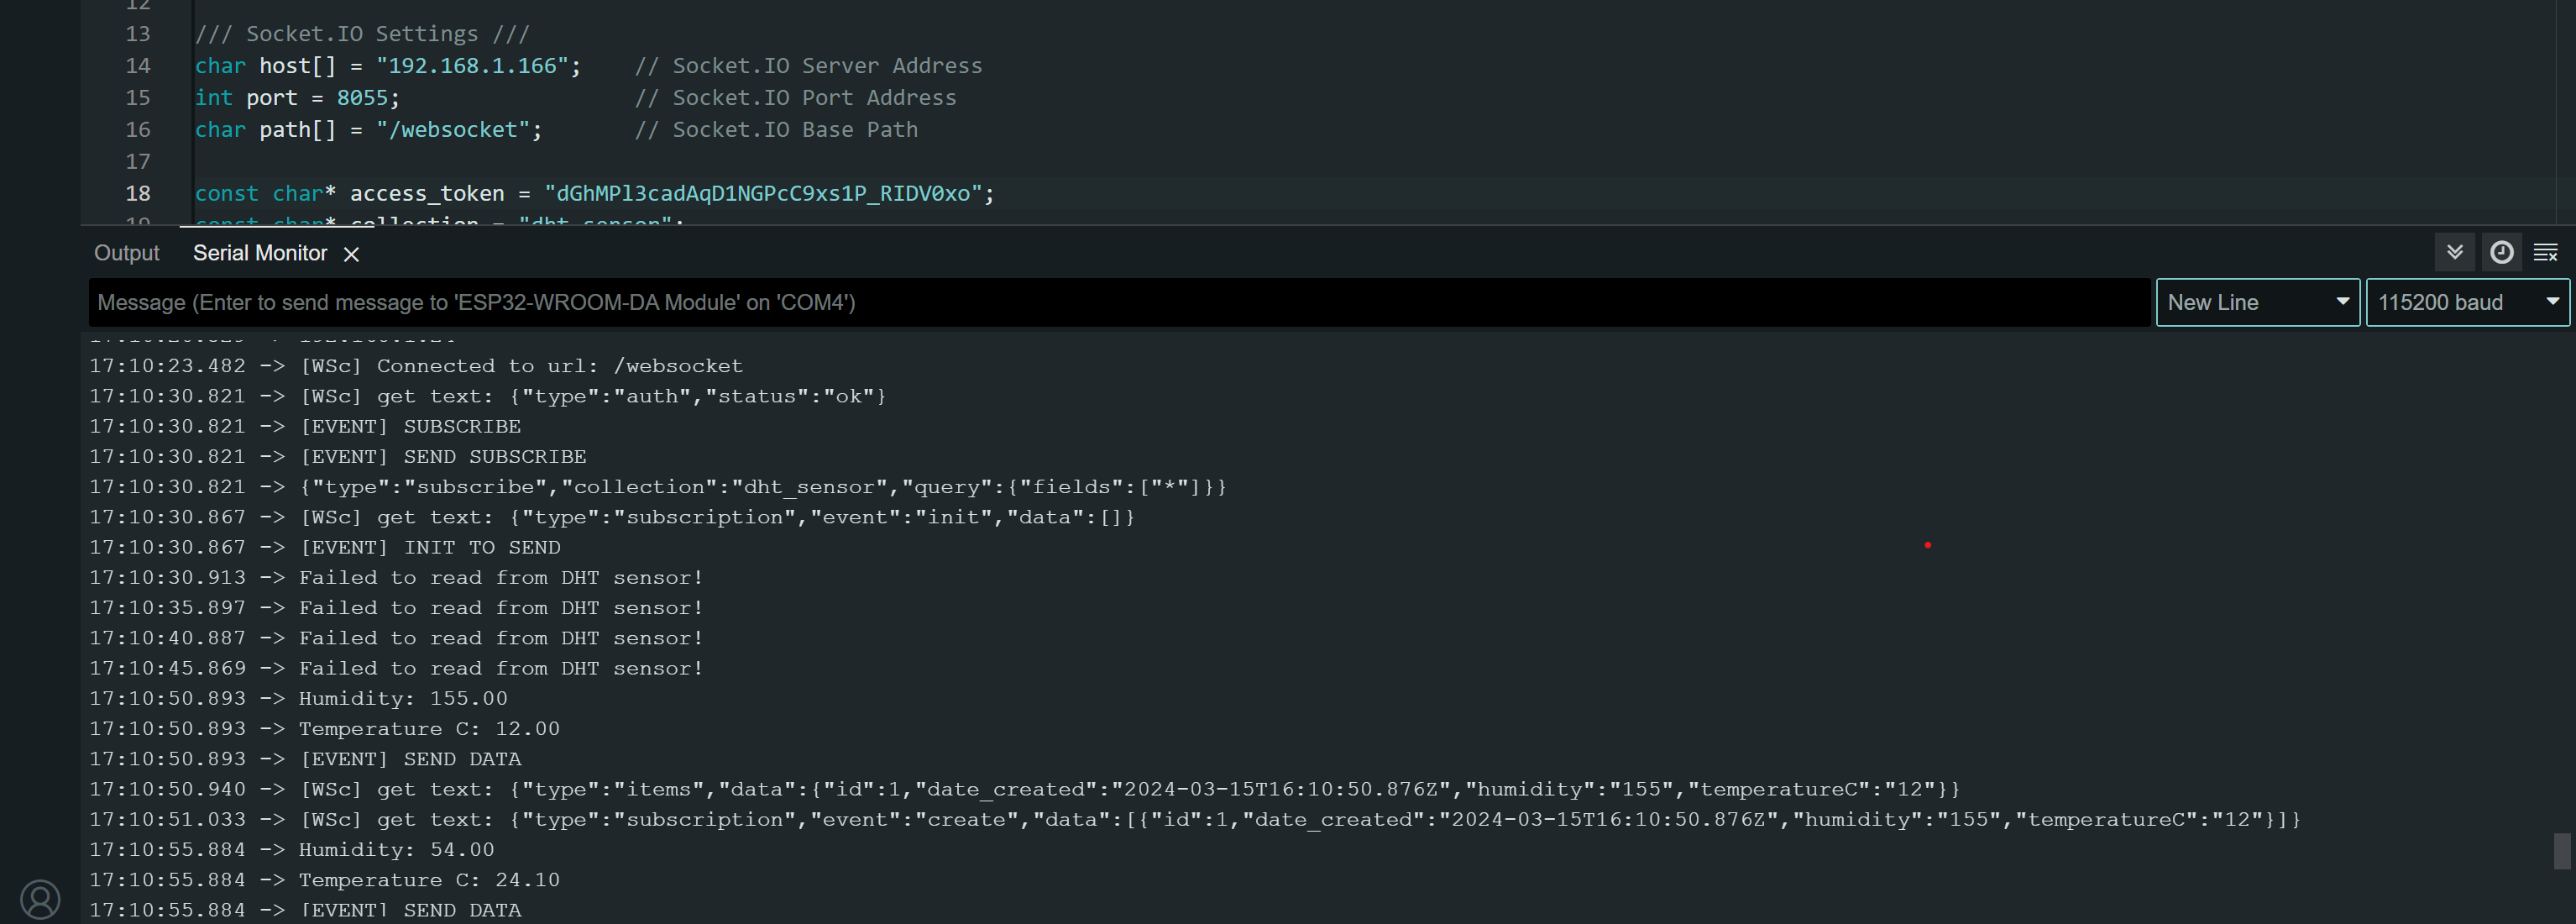
Open Port Monitor: After successful upload, open the serial monitor or terminal in your Arduino IDE. This will display logs and messages from the ESP32.
Review Logs: Inspect the serial monitor output carefully. You should see messages indicating:
Successful connection to the Directus server: Look for messages confirming a connection established with the server.
Authentication status: Verify that authentication using the access token was successful.
Data transmission events (sending sensor readings to Directus): Watch for logs indicating successful data transmission (e.g., sensor readings sent) to Directus.
2. Visualizing Your Sensor Data in Directus
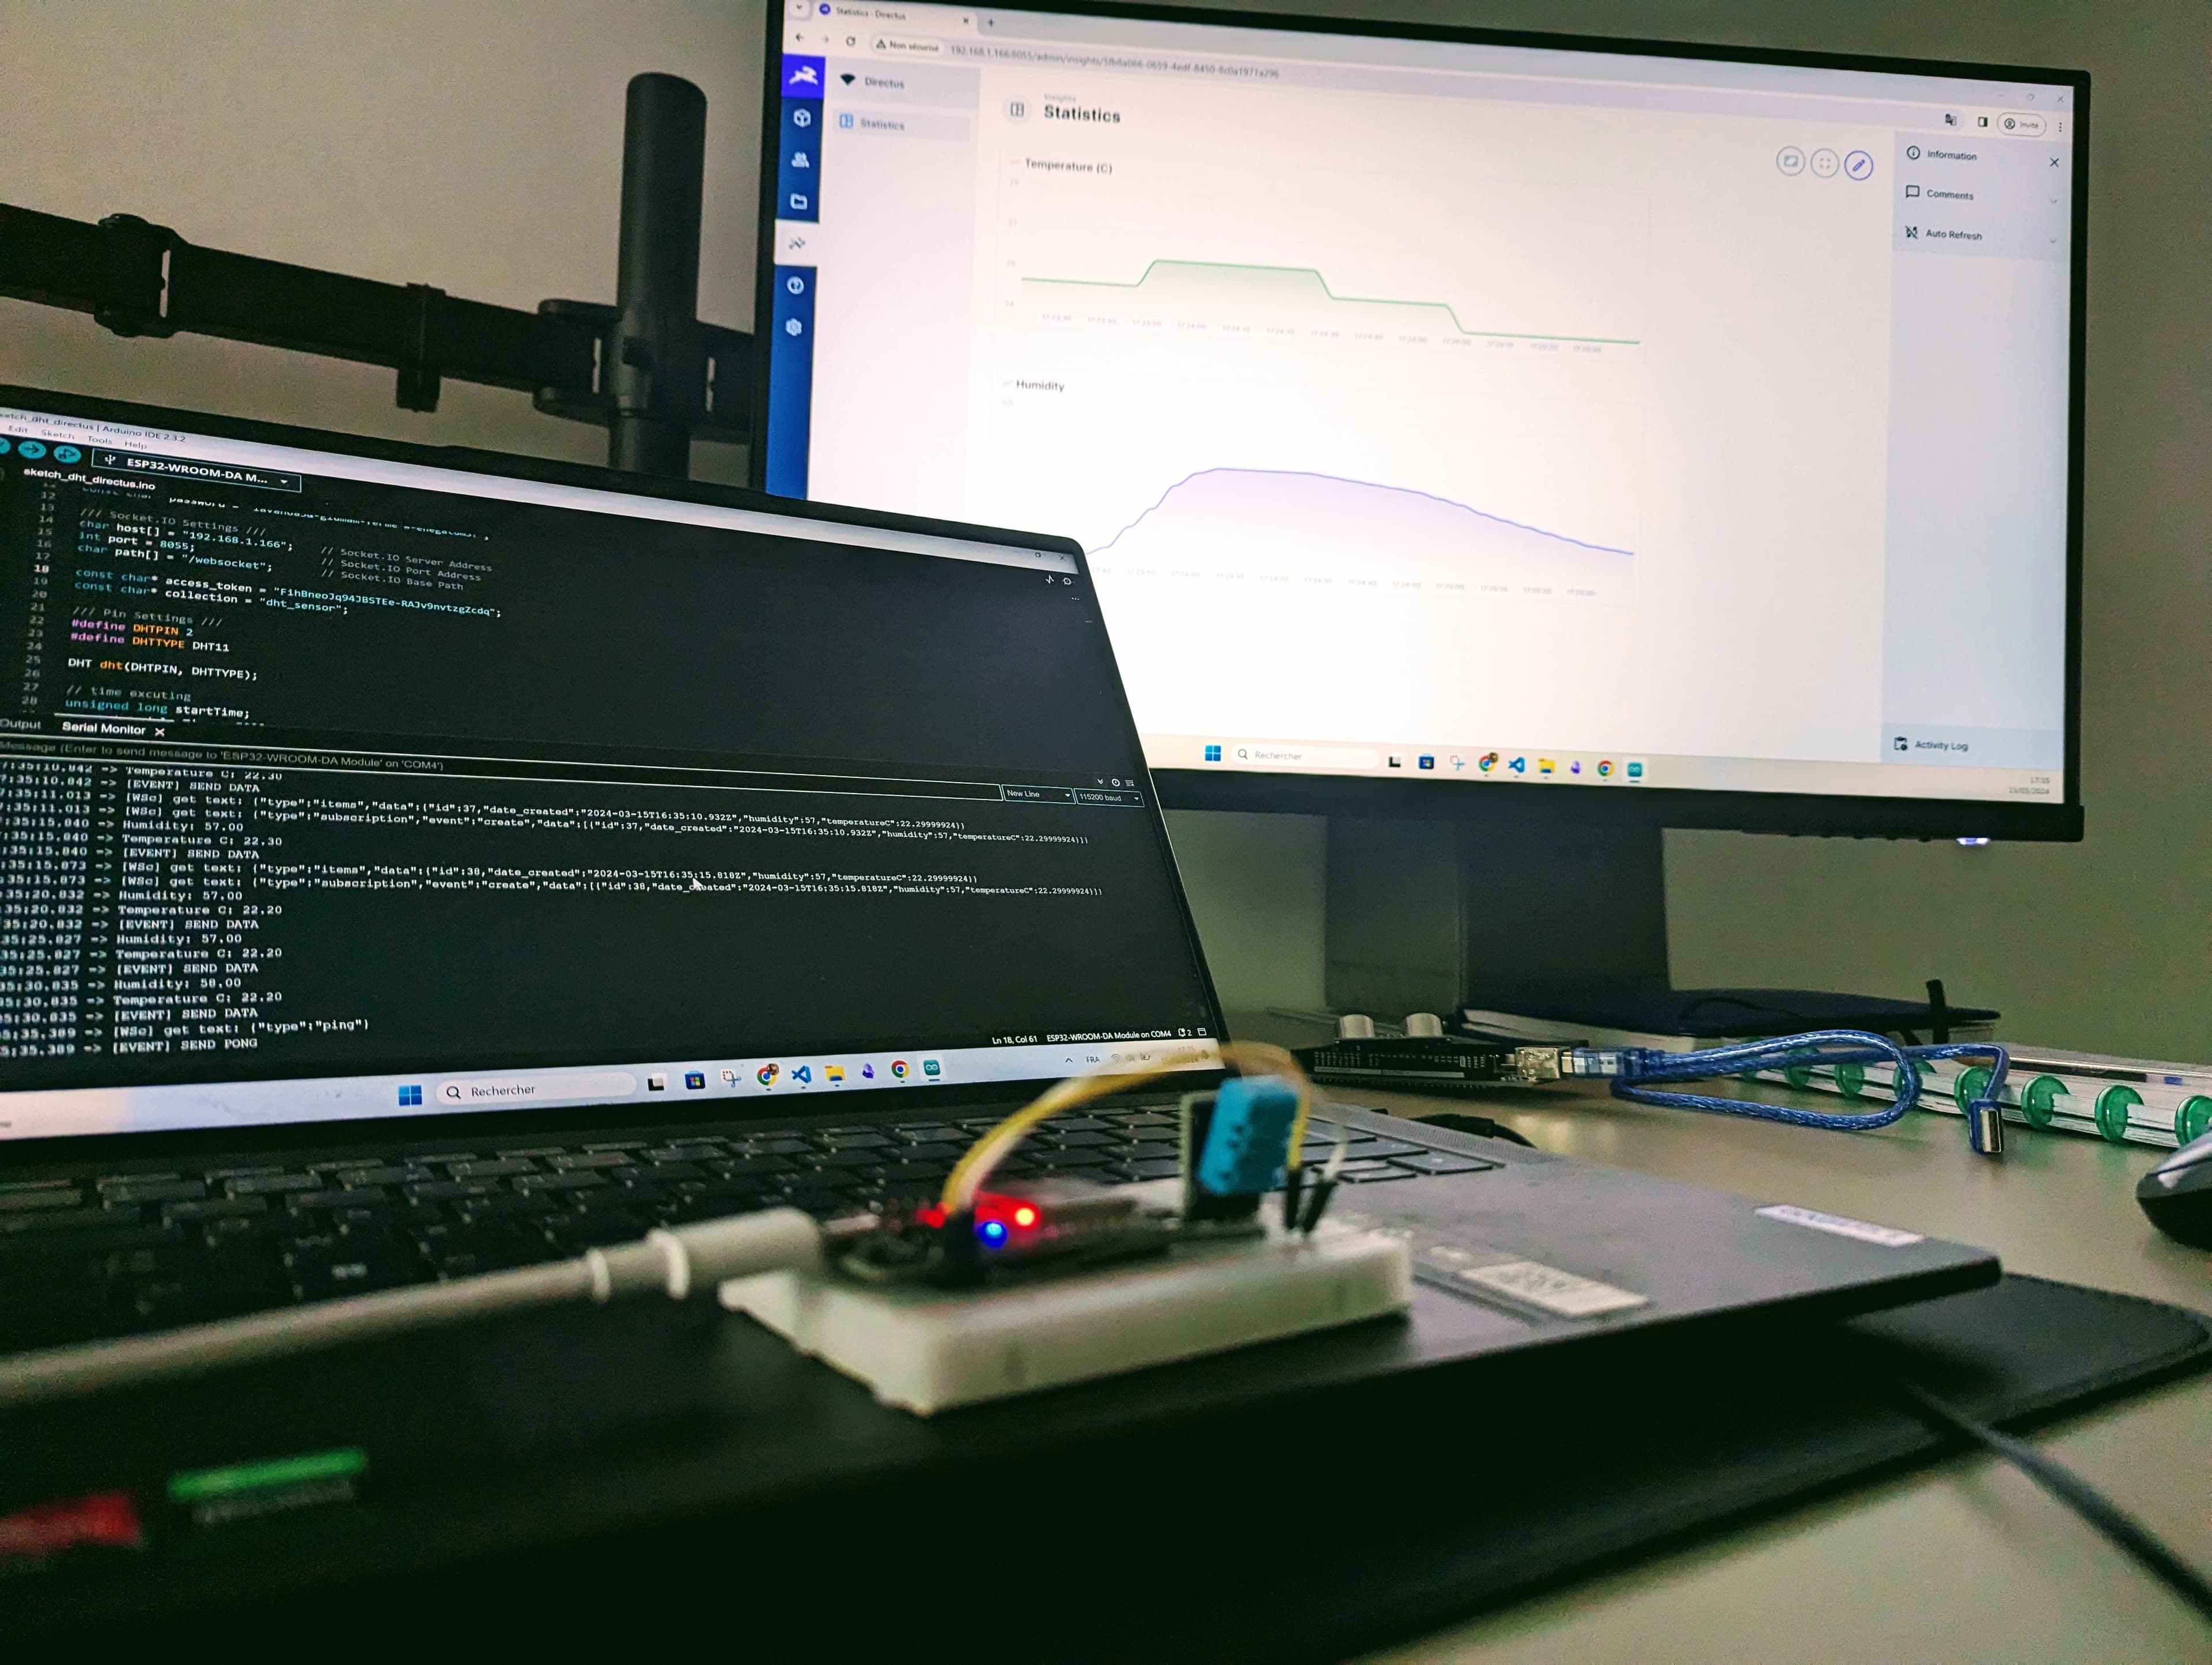
Ready to See Your Data? Now that you've uploaded the code and verified successful data transmission to Directus via WebSocket based on the logs, let's explore how to visualize your sensor data in the dashboard and create graphs (timelines) for clear representation.
Accessing Your Data:
Head to Directus Dashboard: Open your Directus dashboard in a web browser and log in with your credentials.
Locate Your Collection: Navigate to the collection you specifically created for the sensor data (e.g., "dht_sensor").
Behold Your Data!: You should now see a list of entries in the collection, each representing a data point sent from your ESP32. The data will be displayed in a table format by default.
2.1 Visualizing Time Series Data
To visualize the data as a time series graph, as there are a couple of steps I let you watch this video to create it effortlessly.
Now let's explain what we did, we chose the time series graph.
Choosing the Chart Type:
We opted for a time series graph, which is ideal for visualizing data points over time. This allows you to observe trends and patterns in your sensor readings.
Data Source:
Collection: We selected the specific collection in Directus where your sensor data is stored (e.g., "dht_sensor").
Date Field: Directus automatically creates a date field to record the creation time of each data entry. This field serves as the time reference for the graph.
Value Field: We identified the specific field within the collection that contains the sensor readings you want to visualize (e.g., "humidity").
Data Aggregation(Group Aggregation/Group Precision):
Concept: Aggregation refers to combining multiple data points into a single value. This is often achieved using functions like SUM, COUNT, and AVG.
Our Choice: We chose the AVERAGE aggregation to calculate the average value (e.g., average humidity) within a specific time interval.
Group Precision: We opted for "Second" as our group precision. This means the average will be calculated for each second of data received. You can adjust this based on your data collection frequency (e.g., per minute or hour).
Additional Considerations:
Directus offers various aggregation functions and group precision options. Explore these options to customize visualizations based on your specific needs. While we focused on basic configurations here, advanced data manipulation and visualization tools can be integrated with Directus for in-depth analysis.
Expanding Your Sensor Network
Remember, these steps can be adapted for data from other sensors. Just ensure you create the appropriate collection with relevant fields in Directus to accommodate your specific sensor. and edit the socket code to send the correct data in the correct fields
Conclusion
Congratulations! You've successfully connected your ESP32 to the web world and established a real-time data pipeline to Directus. The provided code effectively transmits sensor readings, leveraging WebSockets for efficient communication.
Key Takeaways:
Real-time Data Visualization: By harnessing WebSockets, we achieved near-instantaneous data transmission, allowing you to visualize sensor readings with minimal delay in the Directus dashboard.
Flexibility for Diverse Sensors: This approach can be adapted to work with various sensors. Simply create the appropriate collection with relevant fields in Directus and modify the code to send the correct data accordingly.
Remember: The provided code snippet serves as a solid foundation. Feel free to experiment and customize it further to suit your specific project requirements and desired sensor data.